CPSC 599/601: Visualization of Scientific Data
Overview
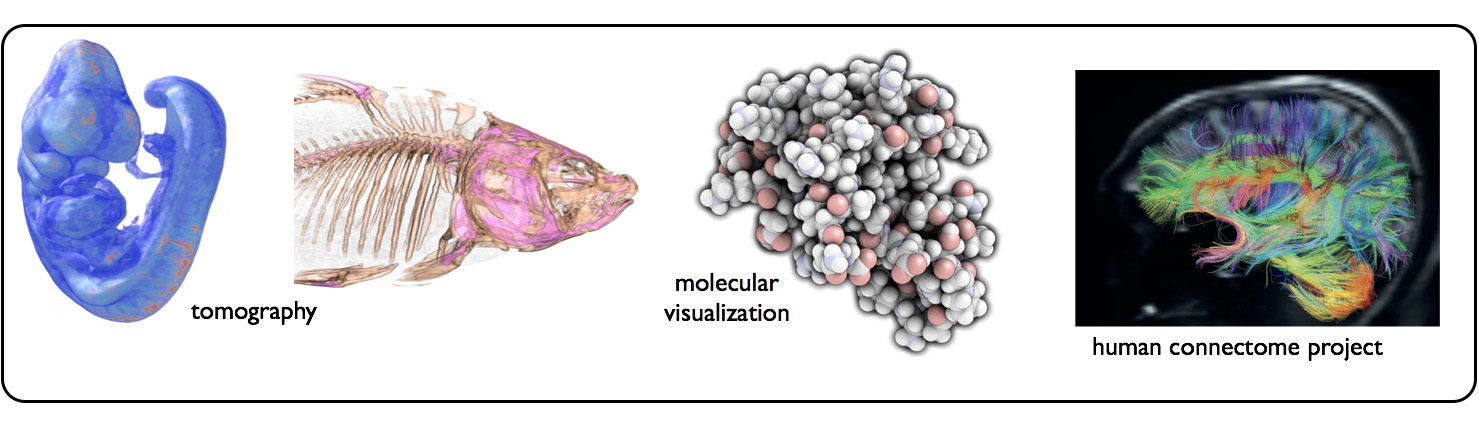
Many scientific disciplines produce large quantities of measured or simulated data. The field of Visualization aims to facilitate the analysis of such data by converting it into visual representations (images, animations, abstractions etc.) through the use of efficient computational algorithms. This gives domain experts a better understanding of the scientific phenomenon being studied. The field of scientific visualization specifically deals with datasets that describe a phenomenon of interest in the three-dimensional physical world. Example domains include, among others, Biomedical Imaging, Computational Fluid Dynamics, Reservoir Geoscience and Engineering, Earth Sciences, Climatology, Molecular Visualization, Archaeology and Architecture.
This course gives students an overview of the most important techniques used in the visualization of scientific data. Additionally, students will gain depth in a particular area of their choice by completing a semester long research project. The course consists of two parts. In the first part, the instructor will lay the groundwork and go over some fundamental techniques in scalar, vector and tensor data visualization. The second part of the course will be run like a seminar and will be more student-centric. Graduate students will get a chance to explore an area of their choice and present a research topic that they are interested in. A major component of the course is a project that the students will propose in the mid-October and present their findings at the end of the term.
This course is not about any specific visualization software tools or APIs although, through the homeworks and the project, you will have a chance to explore software tools such as Paraview and VisIt, and software systems such as VTK.
Grading
| Assignments | 30% |
| Midterm exam | 20% |
| Participation | 10% |
| Final project | 40% |
These weightings are subject to change.
Prerequisites
In order to successfully complete the assignments, participate in the seminar, and deliver a final project, you should have the following prerequisites.
- Linear algebra and multivariate calculus.
- Programming (preferably in one of the C families).
- Knowledge of computer graphics and graphics programming, although not strictly required, will be very helpful.
Texts and Reading
There is no required textbook for the course.
The lectures in the first part will partly be based on the following text books which cover some well-known techniques used in scalar, vector and tensor visualization.
- Data Visualization: Principles and Practice, Alexandru Telea, A K Peters Ltd., 2015.
- The Visualization Handbook, Charles D. Hansen, Chris R. Johnson, Academic Press, 2011.
A reading list will be posted for the topics covered in class. You are expected to keep up with the required reading.
Seminar
In the latter part of the course, we will use the class-time to go through papers that give us a sense of the different research themes, current trends and the state-of-the-art techniques in scientific visualization. Each paper will be presented and lead by a graduate student and all the other participants are expected to have read the paper before coming to class so that we can all engage in fruitful discussions. A detailed schedule and list of the papers will be made available a week or two before the seminar begins (tentatively late October).
Tentative Topics
- Preliminaries
Data representation, grids, data processing and filtering (interpolation, image processing, Fourier analysis, numerical techniques for scientific visualization), visual variables, visualization pipeline, visualization design.
- Scalar Visualization
Colourmaps, contours, isosurface rendering (implicit and explicit), volume visualization (ray casting, transfer function design, GPU based volume visualization).
- Vector Visualization
Integral curves, particle tracing, line integral convolution, stream surfaces, seeding strategies and feature-based flow visualization.
- Tensor Visualization
Glyphs, principle components, tractography.
- Seminar
The seminar will focus on different data modeling and visual representation topics that have recently become popular in the field of data visualization. Tentative topics include: approximation theory and signal processing, data structures for handling large and/or sparse datasets, uncertainty quantification and visualization, information theoretic approaches, graph theoretic approaches, multi-field and high-dimensional data visualization, illustrative visualization, and focus-and-context approaches.
Final Project
A term project is a major component of this course and you are highly encouraged to start thinking about it early. Graduate students will work indivisually while undergraduate students can choose to work in teams. If you already have a good idea of what kind of data you will be using, you can choose a project that relates to the type of data you are interested in visaulizing. On the other hand, if you are just starting out and are not really sure about what kind of data to use, you can take this opportunity to explore a certain scientific visualization topic that is of interest to you.
The project consists of the following deliverables (weightings are subject to change):
- Written proposal - 20% (mid-October).
- Progress presentation - 10% (Last week of classes).
- Project report - 50% (Finals week).
- Project demo/presentation - 20% (Finals week).
Here are some projects that students have completed in the past.
- CPU-based maximum intensity projection of cardiac imagery, Kathleen Ang, Fall 2016.
- Simultaneous visualization of reservoir simulation grid block models and 4D time-lapse seismic shot records, Aris Aristorenas, Fall 2016.
- CPU-based maximum intensity projection of cardiac imagery, Kathleen Ang, Fall 2016.
- Visualizing the vasculature of Gerbera, Kathleen Ang, Fall 2016.
- Exponential box splines for use in Visualization, Joshua Horacsek, Winter 2016.
- Visualizing collision data in a network-distributed path tracer, Haysn Hornbeck, Winter 2016.
- Visualizing blood flow through great vessels of the human body, Fahim Khan, Winter 2016.
- GPU-based volume rendering, Md. Reza Rabbani, Winter 2016.
- Visualization of vector fields using Reaction-Diffusion, Lee Ringham, Winter 2016.
- Sparse manifold learning for visualizing high-dimensional data, Tianshu Yu, Winter 2016.
- Atlas of connectivity maps for Icosahedral Non-hydrostatic (ICON) data, Mohammad Imrul Jubair, Fall 2014.
- Visualization of dendritic network features, Justin Kelly, Fall 2014.
- Volume rendering applied to corner point meshes, Allan Rocha, Fall 2013.
- Scattered data interpolation using Partition of Unity Parametrics (PUPs), Amirhessam Moltaji, Fall 2013.
- Enhanced visualization of temporal data using importance driven animation, Haleh Alemasoom, Fall 2013.