| Java Resources - Profiler (JRat) |
Instructions for Installation
The Java profiler JRat (the “Java Runtime Analysis Tool”) is available on the department’s Unix/Linux systems. You can use it by accessing the jar file
shiftone-jrat.jar
that is stored in the directory
/usr/share/java
You should therefore include the above directory in your CLASSPATH.
The following information may be useful if you wish to install this on a computer at home, as well.
-
Download JRat
The latest version of JRat can be downloaded from
-
Download BCEL (If Necessary)
You also need to download and install the “Byte Code Engineering Library (BCEL).”
You may learn more about this library and download the latest version of it at
-
Add the JRat jar File To Your Classpath
Details about how to do this will depend on the shell that you are using. If you use “bash” then you should be able to do this by typing
CLASSPATH=path /shiftone-jrat.jar; export CLASSPATH
where path should be replaced by the search path to the JRat jar file.
If you are not sure what the full path name is, change directory until you are in the same directory as the jar file and use the command “pwd” to see the path name.
You may wish to use the above command (that sets the CLASSPATH) to your “.bash-profile” or another script, so that you do not have to type it in every time you wish to use JRat.
Instructions for Use
-
Compile Your Program
Compile your program to produce byte code (using javac on a Unix/Linux system) as you normally would.
-
Open the JRat Desktop
If your current directory is the one where the JRat jar file resides, you can do this by typing either
java -jar shiftone-jrat.jar
or
java -jar /usr/share/java/shiftone-jrat.jar
-
Instrument Your Class Files
JRat gets the profiling information it needs by inserting extra code into your class files. To accomplish this you should click the “Instrument” menu, select the command
Inject JAR(s) or Class File(s)
and then select your program’s .class files using the file selector which now appears.
You can do the same thing by selecting
Inject Directories Recursively
from the “Instrument” menu and then selecting the directory where your program’s .class files reside.
In either case, JRat will now report on its progress in the JRat desktop as it processes your .class files.
-
Run Your Program
Run your program as you normally would, except that you should also include the following command-line switch:
-Djrat.factory=org.shiftone.jrat.provider.tree.TreeMethodHandlerFactory
In other words, you should run the program with name MyProgram using the command
java -Djrat.factory=org.shiftone.jrat.provider.tree.TreeMethodHandlerFactory MyProgram
You will notice that your program sends more output to the screen than it usually does. This is diagnostic information from JRat, and you should not worry about it.
-
Analyze Your Program’s Performance
After your program has finished, you will notice that a new directory has been created and that this contains a pair of output files created by JRat.
Open the JRat desktop (as described above) and select the command
Open JRat Output File
from the “File” menu. Using the file selector that now appears to select the .xrat file that JRat has created.
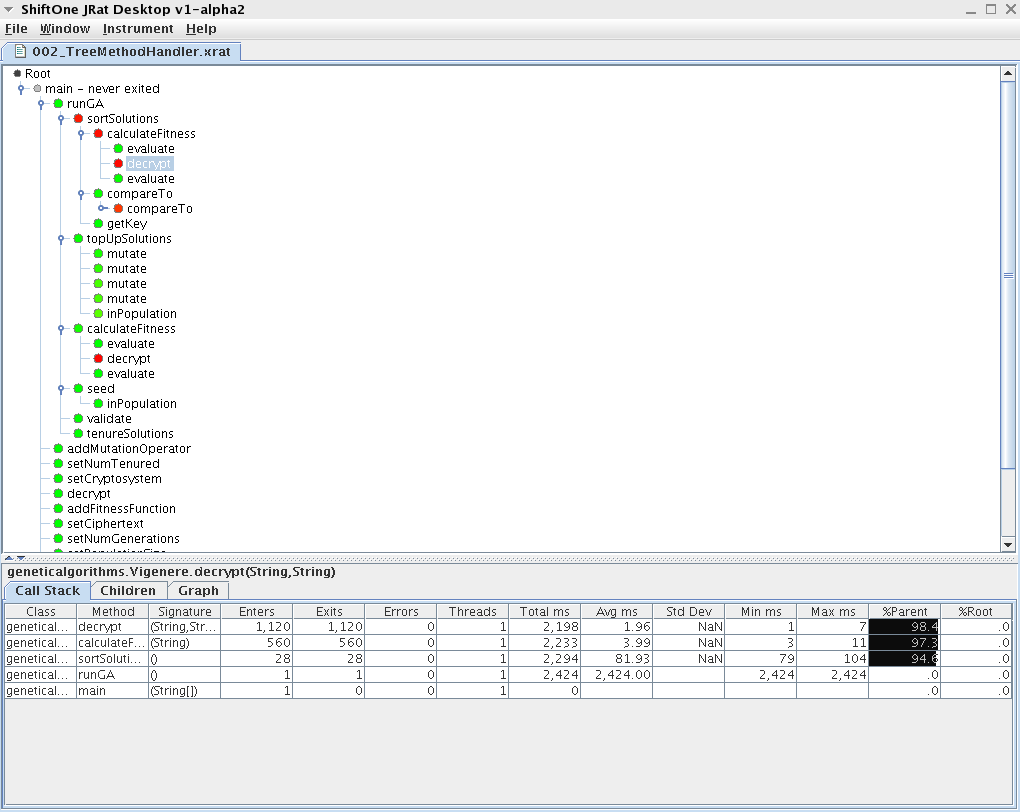
A tree-like representation (broken down by method), looking like the following, should now appear.

Methods with green dots beside them are methods that do not use a large proportion of the program’s running time. Methods with red dots use more of the running time.
You can navigate this tree with a mouse. When any method is selected, you can see how many times the method has been executed, how much time (in milliseconds) was spent in the method, and the average amount of time (in millisecond) that used each time the method was executed: This information should appear at the bottom of the JRat desktop.
Additional Information
The JRat home page has quite a bit of other useful information about this profiler.
Thanks, Karel!
Karel Bergmann provided the instructions that appear at the beginning of this page.
Help Us To Improve This!
Please send email to the instructor if you found mistakes on this page or can suggest other information about JRat that will helpful for other students in CPSC 331.
|
This page last modified:
http://www.cpsc.ucalgary.ca/~jacobs/cpsc331/W07/java/profiler.html |