WebGrid Plus Update—Synopsis Tool
25/12/15 16:03
We have just updated the WebGrid server at webgrid.uvic.ca to make more capabilities of Rep Plus available through the Internet.
Estimate of number of significant components
There have been several attempts to develop measures of 'complexity,' 'intensity' and other overall indices of the structure represented in a grid. Most are heuristics with no theoretical foundations and have a poor track record of meaningful use/validation. However, it is useful to be able to make a rapid assessment of a grid—the extent to which the constructs differentiate/integrate the elements—the extent to which the elements instantiate the similarities and differences between the constructs.
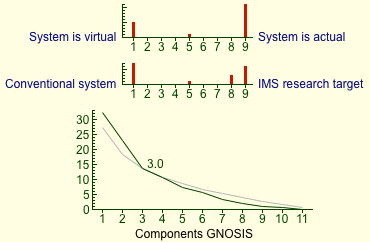
The Synopsis tool in Rep Plus provides histograms of the distribution of element ratings on each construct, and a scree plot of a principal components analysis including an estimate of the number of significantly different components.
The estimate of significant components is based on a technique proposed by Frontier (1976), validated on a range of datasets in comparison with other techniques for estimating the number of meaningful components by Jackson (1993), and promoted by Legendre & Lengendre (2012) in their handbook of Numerical Ecology.
The scree plot shows not only the usual broken stick distribution of the variance attributable to each component but also the expected distribution if the variance arose from a random process with no underlying structure. The intersection(s) of the two plots provide an estimate, or estimates, of the number of significant components.
Plural estimates arise because there may be more than one plausible structure, for example one based on two dominant components, and another based on several more components, both of which have greater than chance probabilities of not being artifacts.
Validation of the technique in the literature is based on datasets from other disciplines. We have tested it on a wide range of grid data including examples from the expert systems/knowledge engineering literature that have a known underlying structure, and confirmed that it accurately estimates the dimensionality of the structure represented in the grid.
Examples
An example of part of a synopsis of one of the WebGrid sample grids is shown below:
An example of a scree plot from a grid generated from a known hierarchical structure is shown below. It is taken from a paper on Developing hierarchical knowledge structures from flat grids (Gaines & Shaw, 1998) written for the knowledge modelling and semantic web communities to show how hierarchical ontologies could be extracted from grids.
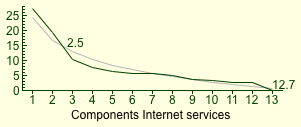
When one examines the original hierarchy of Internet services (Gaines, Chen & Shaw, 1997) that the grid represents one can see that it has two dominant constructs at the top level and twelve significant constructs in total. The analysis has recovered this from the grid (the stopping rule in the literature is to round down to the nearest integer in estimating the number of significant components).
We hope colleagues will experiment with using the Synopsis tool in WebGrid to analyze their own data, and would be pleased to receive comments and suggestions.
Citations
Frontier, S. (1976). *Étude de la décroissance des valeurs propres dans une analyse en composantes principales: Comparaison avec le modd́le du bâton brisé.* Journal of Experimental Marine Biology and Ecology 25, 67-75.
Jackson, D. A. (1993). *Stopping rules in principal components analysis: A comparison of heuristical and statistical approaches.* Ecology 74, 2204-2214.
Legendre, P. and Legendre, L. (2012). *Numerical ecology.* Elsevier, Amsterdam.
Shaw, M. L. G. and Gaines, B. R. (1998). *WebGrid II: Developing hierarchical knowledge structures from flat grids.* In Proceedings of Eleventh Knowledge Acquisition Workshop Gaines, B. R. and Musen, M. A., eds.
Gaines, B. R., Chen, L. L.-J. and Shaw, M. L. G. (1997). *Modeling the human factors of scholarly communities supported through the Internet and World Wide Web.* Journal American Society Information Science 48, 987-1003.
Estimate of number of significant components
There have been several attempts to develop measures of 'complexity,' 'intensity' and other overall indices of the structure represented in a grid. Most are heuristics with no theoretical foundations and have a poor track record of meaningful use/validation. However, it is useful to be able to make a rapid assessment of a grid—the extent to which the constructs differentiate/integrate the elements—the extent to which the elements instantiate the similarities and differences between the constructs.
The Synopsis tool in Rep Plus provides histograms of the distribution of element ratings on each construct, and a scree plot of a principal components analysis including an estimate of the number of significantly different components.
The estimate of significant components is based on a technique proposed by Frontier (1976), validated on a range of datasets in comparison with other techniques for estimating the number of meaningful components by Jackson (1993), and promoted by Legendre & Lengendre (2012) in their handbook of Numerical Ecology.
The scree plot shows not only the usual broken stick distribution of the variance attributable to each component but also the expected distribution if the variance arose from a random process with no underlying structure. The intersection(s) of the two plots provide an estimate, or estimates, of the number of significant components.
Plural estimates arise because there may be more than one plausible structure, for example one based on two dominant components, and another based on several more components, both of which have greater than chance probabilities of not being artifacts.
Validation of the technique in the literature is based on datasets from other disciplines. We have tested it on a wide range of grid data including examples from the expert systems/knowledge engineering literature that have a known underlying structure, and confirmed that it accurately estimates the dimensionality of the structure represented in the grid.
Examples
An example of part of a synopsis of one of the WebGrid sample grids is shown below:
An example of a scree plot from a grid generated from a known hierarchical structure is shown below. It is taken from a paper on Developing hierarchical knowledge structures from flat grids (Gaines & Shaw, 1998) written for the knowledge modelling and semantic web communities to show how hierarchical ontologies could be extracted from grids.
When one examines the original hierarchy of Internet services (Gaines, Chen & Shaw, 1997) that the grid represents one can see that it has two dominant constructs at the top level and twelve significant constructs in total. The analysis has recovered this from the grid (the stopping rule in the literature is to round down to the nearest integer in estimating the number of significant components).
We hope colleagues will experiment with using the Synopsis tool in WebGrid to analyze their own data, and would be pleased to receive comments and suggestions.
Citations
Frontier, S. (1976). *Étude de la décroissance des valeurs propres dans une analyse en composantes principales: Comparaison avec le modd́le du bâton brisé.* Journal of Experimental Marine Biology and Ecology 25, 67-75.
Jackson, D. A. (1993). *Stopping rules in principal components analysis: A comparison of heuristical and statistical approaches.* Ecology 74, 2204-2214.
Legendre, P. and Legendre, L. (2012). *Numerical ecology.* Elsevier, Amsterdam.
Shaw, M. L. G. and Gaines, B. R. (1998). *WebGrid II: Developing hierarchical knowledge structures from flat grids.* In Proceedings of Eleventh Knowledge Acquisition Workshop Gaines, B. R. and Musen, M. A., eds.
Gaines, B. R., Chen, L. L.-J. and Shaw, M. L. G. (1997). *Modeling the human factors of scholarly communities supported through the Internet and World Wide Web.* Journal American Society Information Science 48, 987-1003.